
Introduction to spatial points in R
Contributors: Clark S. Rushing
This activity will introduce you to working with spatial points in R.
R Skill Level: Intermediate - this activity assumes you have a working knowledge of R
Objectives & Goals
Upon completion of this activity, you will:- know how to create and write spatial points
- Be able to project spatial points
- Be able to calculate distances between points
Required packages
To complete the following activity you will need the following packages installed: raster sp rgeosInstalling the packages
If installing these packages for the first time consider addingdependencies=TRUEinstall.packages("raster")install.packages("sp")install.packages("rgeos")Download R script Last modified: 2019-09-20 18:26:28
What are spatial points?
Spatial points are a set of spatially explicit coordinates that represent a geographic location. Each point represents a location on a surface. Spatial points are created from a series of x and y coordinates. Spatial points can be combined with data frames to create what’s called a SpatialPointsDataFrame. The difference between SpatialPoints and SpatialPointsDataFrame are the attributes that are associated with the points. SpatialPointsDataFrames have additional information associated with the points (e.g., site, year, individual, etc.) while SpatialPoints contain only the spatial information about the point.
Creating & writing spatial points
Spatial Points in R
Let’s begin by creating a set spatial points layer from scratch. We’ll use the sp package to make a SpatialPoints object using randomly generated XY coordinates. Once we create a SpatialPoints object in R - we’ll take a closer look at its metadata and structure.
load the sp package if you haven’t already done so. If you need to install the sp package - see how to do that here
# load library
library(sp)
Now that the sp library is loaded we can use the SpatialPoints() function to create a SpatialPoints object in R.
# Generate 100 random X and Y coordinates
# with longitude and latitude in the familiar
# degrees

x_coords <- runif(n = 100, min = -100, max = -80)
y_coords <- runif(n = 100, min = 25, max = 45)

# Have a look at the first coordinates
head(cbind(x_coords,y_coords))
##       x_coords y_coords
## [1,] -94.08413 43.83492
## [2,] -84.31071 42.45115
## [3,] -82.96326 30.66174
## [4,] -80.70545 38.85120
## [5,] -97.65633 40.07562
## [6,] -82.78829 26.80323
Now that we have generated random coordinates we can make those data spatially explicit. We’ll use the SpatialPoints function in the sp package to do that. Before we use the function let’s see what arguments we need to pass to SpatialPoints.
args("SpatialPoints")
## function (coords, proj4string = CRS(as.character(NA)), bbox = NULL)
## NULL
The SpatialPoints function is looking for coordinates (coords), a projection / datum argument (proj4string) and a bounding box (bbox). Both proj4string and bbox have preset values so we don’t need to specify them - it’ll use the defaults. Let’s use those options for now.
The coords input looking for a specific type of input. It needs a matrix or data.frame where the first column is longitude and second is latitude. Note - the order is LONGITUDE then LATITUDE.
# coords = c(longitude,latitude)

firstPoints <- SpatialPoints(coords = cbind(x_coords,y_coords))
Let’s have a look at what we just created.
str(firstPoints)
## Formal class 'SpatialPoints' [package "sp"] with 3 slots
##   ..@ coords     : num [1:100, 1:2] -94.1 -84.3 -83 -80.7 -97.7 ...
##   .. ..- attr(*, "dimnames")=List of 2
##   .. .. ..$ : NULL
##   .. .. ..$ : chr [1:2] "x_coords" "y_coords"
##   ..@ bbox       : num [1:2, 1:2] -100 25 -80 44.6
##   .. ..- attr(*, "dimnames")=List of 2
##   .. .. ..$ : chr [1:2] "x_coords" "y_coords"
##   .. .. ..$ : chr [1:2] "min" "max"
##   ..@ proj4string:Formal class 'CRS' [package "sp"] with 1 slot
##   .. .. ..@ projargs: chr NA
We can plot the points in space by simply using the plot function.
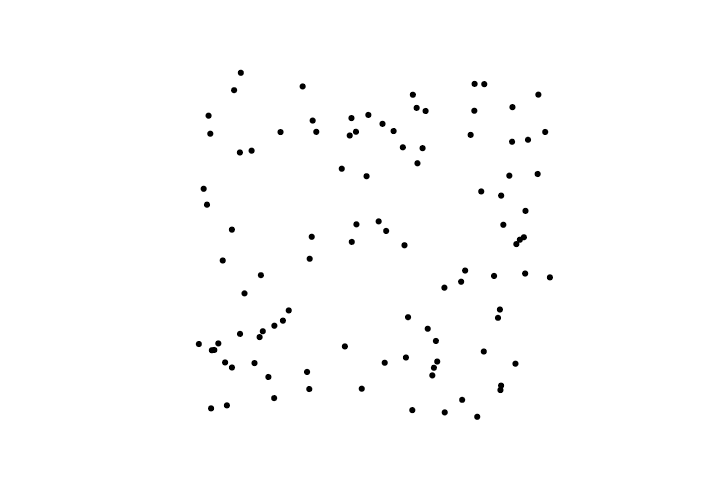
plot(firstPoints, pch = 19)
Writing a shapefile
We can save our firstPoints object as a shapefile using the raster package. The shapefile function in the raster package is very convienent in that it can both read a shapefile into R but it can also write a SpatialPoints or other spatial object classes (lines, polygons, etc.) to a shapefile.
library(raster)
shapefile(x = firstPoints, file = "path/to/output/file.shp")
Calculate distance between points
One task that may be useful now that we have spatial points is calculating the distance between points either within the same layer or between two layers. Since we already have a SpatialPoints file, we’ll calculate the distance between points. We need to be a little careful here. First, we need to make sure we’re calculating the distance we intend to calculate. Let’s start simple and get Euclidean distances in the units of the SpatialPoints layer. If in meters, it’ll return meters. If degrees, it’ll return degrees.
# longlat = FALSE returns Euclidean distance
euclidDist <- sp::spDists(firstPoints,longlat = FALSE)
## num [1:100, 1:100] 0 9.87 17.24 14.28 5.19 ...
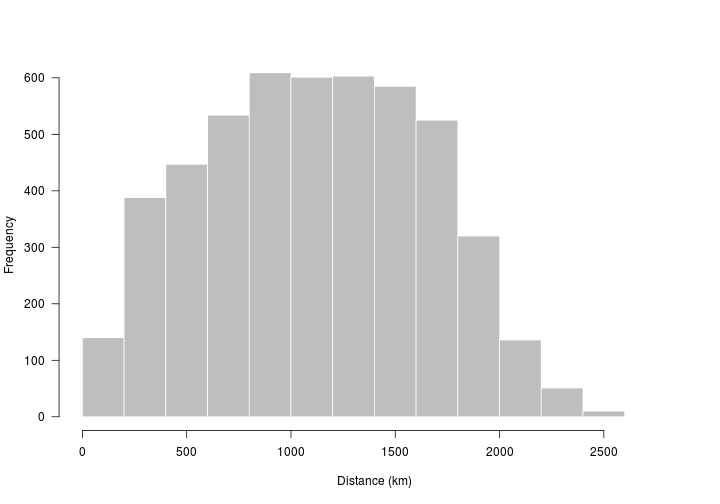
Another option is to calculate the GreatCircle distance.
# longlat = TRUE returns GreatCircle distance
gcDist <- sp::spDists(firstPoints,longlat = TRUE)
## num [1:100, 1:100] 0 809 1760 1247 512 ...
We’ll dive a bit deeper into point-based analyses in spatial predicates and in the activities